It was all preplanned before a single vote was tallied! – via Truth Is Freedom on X
Reported by:

Cherry Meigh Timbol
News Content Editor
Published November 10, 2026
WASHINGTON, D.C. — A controversial claim alleging that Democrats’ victories in the 2026 U.S. midterm elections followed a predetermined mathematical formula has sparked debate online, raising questions about voting patterns, statistical analysis, and the reliability of allegations of election manipulation.
The claim was highlighted in a November 10 article published by The Gateway Pundit, which cited an analysis attributed to a social media account known as Truth Is Freedom. The analysis argued that Republican and Democratic vote shares across multiple states followed a remarkably consistent relationship with the results of the 2024 presidential election.
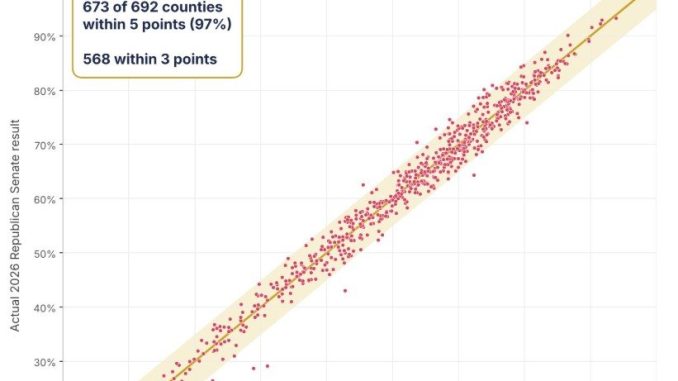
According to the proposed formula, Republican candidates in 2026 retained approximately 85% of former President Donald Trump’s 2024 vote share, while Democratic candidates gained an equivalent portion of the remaining share.
Republican 2026 vote share: 0.85 × Trump’s 2024 vote share.
Democratic 2026 vote share: Harris’s 2024 vote share + (0.15 × Trump’s 2024 vote share).
The analysis initially compared results from 59 Senate and gubernatorial contests. A subsequent county-level analysis reportedly found that 673 of 692 counties fell within five percentage points of a more detailed proposed formula.
The article characterized the pattern as evidence that election outcomes had been predetermined and called for further investigation.
Questions Surrounding the 15% Formula
The central argument rests on the observation that Republican candidates appeared to retain approximately 85% of Trump’s previous vote share in several states, while Democrats received a corresponding share of the difference.
Supporters of the theory argue that the consistency across different states and political contests is unusual, particularly because Senate and gubernatorial candidates operate under different political circumstances.
However, a mathematical relationship between two election cycles does not, by itself, establish coordinated manipulation or fraudulent vote counting.
Election results can be influenced by several factors, including voter turnout, changes in political preferences, candidate popularity, demographic shifts, campaign strategies, and dissatisfaction with the governing party.
Independent Fact-Checking Identifies Significant Variations
An investigation published by Lead Stories on November 8 examined the claim that a uniform 15% formula accurately described Republican performance across the 2026 Senate races.
Its analysis found that the proposed formula did not consistently match actual election results. While several states showed results close to the predicted figures, other states demonstrated substantial differences in both directions.
The fact-check concluded that the available results did not support the claim of a uniform mathematical pattern across all the contests examined.
This distinction is important because a formula that approximates some election outcomes cannot automatically be treated as evidence of an algorithm controlling vote totals.
Democratic Gains Also Reflect Broader Voting Trends
Separate reporting by Reuters documented substantial Republican losses across the country.
According to its November 4 analysis, Republican vote shares declined in 99% of counties counted, with an average decrease of approximately eight percentage points compared with Trump’s 2024 performance.
The report also identified significant Democratic gains in several states, including Texas and Kansas, suggesting that the election reflected a broader political shift rather than an isolated pattern in a handful of contests.
Pew Research Center’s preliminary assessment also found that pre-election polling generally captured the direction of the Democratic advantage but underestimated its eventual size in many major races. Researchers pointed to differences in voter enthusiasm and participation as possible explanations, while noting that further analysis would be necessary to understand the results fully.
Calls for Further Investigation
The controversy has prompted calls from supporters of the theory for more detailed examination of election records, including:
– Comparisons between voter check-in records and ballots counted.
– Examination of paper ballots and hand-count audits.
– Reviews of voter registration and turnout records.
– Independent statistical assessments of voting patterns across different states and counties.
These measures could help establish whether the reported statistical similarities reflect ordinary electoral behavior or warrant further scrutiny.
However, demonstrating irregularities would require verifiable evidence from election records, audits, or investigations. Statistical similarities alone are insufficient to establish that votes were altered or that election results were predetermined.
What Is Established So Far?
The proposed 15% formula has generated legitimate questions about how election data should be analyzed, particularly when comparing results from different election cycles.
Nevertheless, the available independent assessments do not establish that Democrats used a predetermined formula to manipulate the 2026 midterm elections. Nor has the mathematical analysis provided publicly verified evidence of an organized vote-manipulation mechanism.
The distinction between an unusual statistical observation and proven election fraud remains central to the controversy.
For now, the formula remains an allegation requiring independent verification, rather than an established explanation of the 2026 election results.
The Bottom Line
A mathematical formula claiming to explain Democratic gains across hundreds of U.S. counties has fueled allegations of election manipulation. Although the reported similarities merit examination, independent analysis has identified significant variations, and no verified evidence currently establishes that the 2026 midterm elections were predetermined or manipulated.