By Tom Harris, Todd Royal, The Other Side of The Story – America Out Loud
According to the latest (2019) report of the Climate Change Reconsidered (CCR) series of reports from the Nongovernmental International Panel on Climate Change (NIPCC):
“There is little evidence that the warming of the twentieth and early twenty-first centuries has caused a general increase in “extreme” weather events. Meteorological science suggests a warmer world would see milder weather patterns.”
Real-time global temperature
That makes sense. It was during colder periods when we saw the most extreme weather. Now we have reliable data from around the world that supports this contention. It is part of the Global Extreme Weather and Climate Change Dashboard (GWX), a compilation of extreme weather records from all continents assembled by Dr. Roger Pielke Jr., senior fellow at the American Enterprise Institute and writer of The Honest Broker Substack.
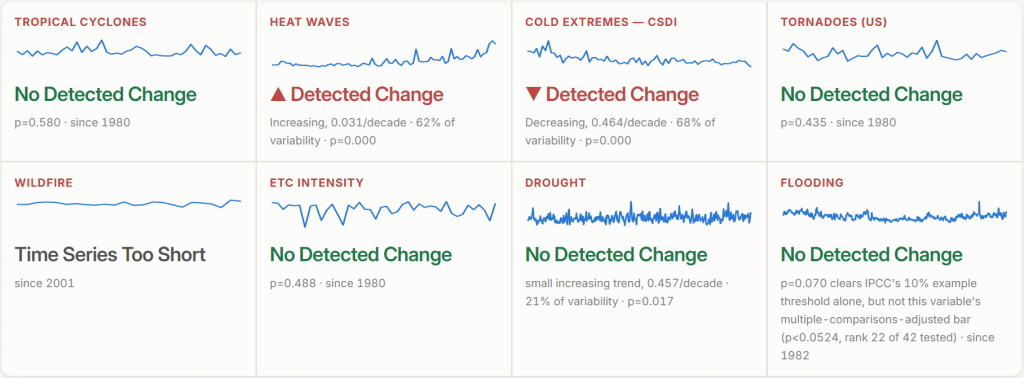
As explained by Pielke, his dashboard “covers … 8 phenomena and for the entire world and every continent.” These eight phenomena are heat waves, cold extremes, tornadoes, flooding, drought, winter storms, wildfires, and hurricanes.
In the image below from Pielke’s site, we can see global trends for the eight extreme weather phenomena: there is no detected change in five phenomena, a decrease in cold extremes, and a slight increase in heat waves. We do not have enough data to detect a trend in wildfires, as thirty years is the minimum length of time needed, although looking at what wildfire data we have from 2001 to 2024, there is no noticeable change in the 23 years on record.